import numpy as np
import networkx as nx
import matplotlib.pyplot as pltSummary
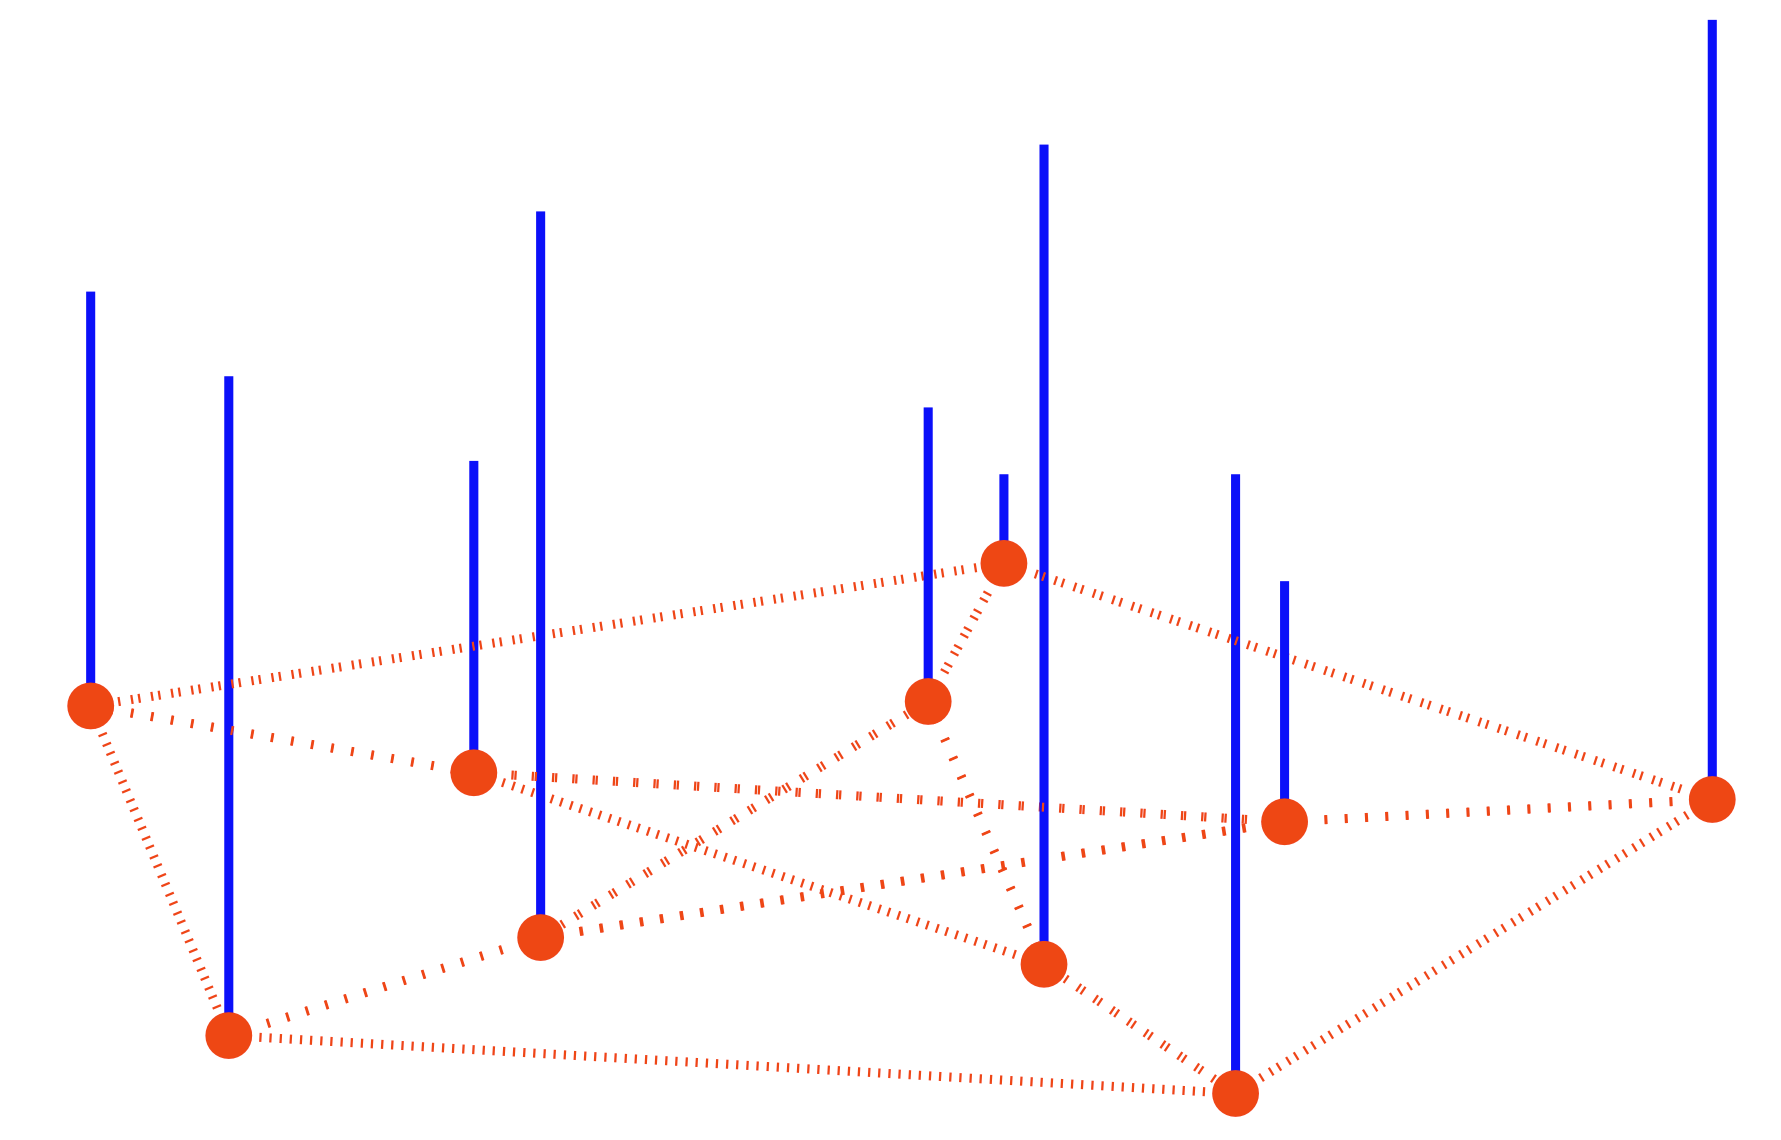
the given signal is observed on a graph \({\cal G}:=({\cal V},{\cal E})\)
- \({\cal V}\) represents the set of nodes
- \({\cal E}\) represents the set of edges (links)
- we have observed a real-valued signal, denoted as \(y: V \to \mathbb{R}\)
Import
Graph Signal
Shuman, David I, Sunil K Narang, Pascal Frossard, Antonio Ortega, and Pierre Vandergheynst. 2013. “The Emerging Field of Signal Processing on Graphs: Extending High-Dimensional Data Analysis to Networks and Other Irregular Domains.” IEEE Signal Processing Magazine 30 (3): 83–98.
Suppose we have observed a real-valued signal, denoted as \(y: V \to \mathbb{R}\), from a graph \({\cal G} = (V, E)\), where \(V\) represents the set of nodes and \(E\) represents the set of edges.